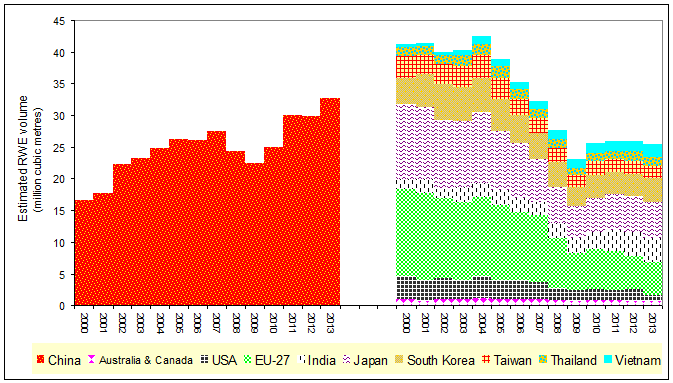
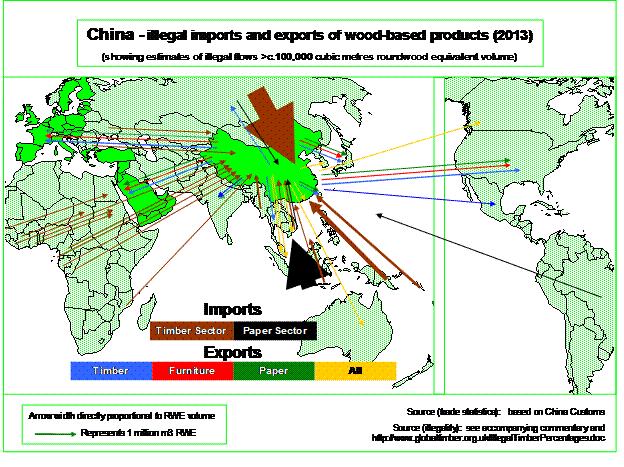
|  
            
            Note 
            This analysis should be treated as a first iteration towards quantifying 
            the order of magnitude of illegal wood-based product trade to and 
            from China. 
          It clearly shows 
            the probable importance of the USA as a market for illegal wood-based 
            products and begs questions about the actual intent of the US President's 
            "Initiative 
            against Illegal Logging" - which, although in many ways welcome 
            - does not appear to seek to address the USA's own illegal imports 
            (and its role in driving illegality). 
          The analysis indicates 
            that the import value of the illegal wood-based products which the 
            USA is likely to import from China alone during 2006 is in the order 
            of US$3.5 billion (mainly attributable to wooden furniture), roughly 
            200 times greater than the sum allocated to the USA's initiative against 
            illegal logging initative. 
          During 2006, China 
            was probably the world's 
            leading importer of illegal timber and one of its principal suppliers 
            of illegal timber. 
          China - illegal 
            imports 
            A high proportion of China's 
            imports of wood-based products are associated with illegality 
            - here defined as "in conflict with either the letter or intent 
            of the law or otherwise associated with corrupt practice". 
          Neither the State 
            Foresty Administration nor the Ministry of Commerce appear (willing 
            or) able to take responsibility for the manufacture and trade of illegal 
            wood-based products. The clear and increasing weakness of Beijing 
            relative to local government is a major handicap to both these institutions. 
             
          The following 
            percentages are based on those which are estimated in "Which 
            10 Bilateral Flows Have Most Salience to International Effort Against 
            "Illegal Timber"? They pertain solely to China's (production 
            and imports) in 2007 - other percentages might be approriate in other 
            years or for other importing countries. Indeed, China's imports from 
            any given country are likely to contain a greater proportion of Illegal 
            Timber than any those of other importing country. 
          Brazil: 70% (China's 
            focus is almost entirely on tropical timber) 
            Burma: 
            >90% (very large mismatch between official exports and declared 
            imports; national law is in abeyance) 
            Cambodia: 100% 
            Cameroon: 
            80% (primarily logs) 
            China: 
            40% (production in excess of quota and other unaccounted production 
            [Table 
            9] and [p4]) 
            Congo 
            (Brazzaville): 90% (flagrant disregard for the law, including 
            by the country's current ruler in the granting of concessions; 
            China's primary interest is logs but the law seeks processing prior 
            to export) 
            Equatorial 
            Guinea: 90% (flagrant disregard for the law concerning maximum 
            allowable cut and de facto concession size attributable to 
            one company (and its sponsors) which supplies most of China's imports) 
            Gabon: 
            80% (flagrant disregard for the law - China's primary interest is 
            logs but the law seeks processing prior to export; tax not paid on 
            two thirds of area allocated as forest concessions) 
            Guyana: 
            60% (flagrant disregard of forest policy concerning local processing 
            prior to export; absence of management plans; logging other than by 
            the legal concessionaire) 
            Indonesia 
            (timber): 90% (mirror 
            statistics indicate that customs fraud is apparent mainly in respect 
            of supplies to China - justifying an increase above the 83% rate of 
            illegal logging in natural forest) 
            Indonesia 
            (pulp and paper): 90% (much pulpwood from natural forest; primarily 
            from fraudulently financed mills) 
            Malaysia: 
            40% (primarily from Sarawak - improperly allocated concessions; illegal 
            timber from Indonesia) 
            Mozambique: 
            80% (assuming Zambézia province is typical; log exports discouraged) 
             
            Papua 
            New Guinea: 90% (surge in China's imports has undermined efforts 
            to improve governance in the sector) 
            Russia 
            (timber): 60% (absence of law enforcement, forest frontier moving 
            west as resources become exhausted, pressure to maximise imports before 
            application of log export tarrifs) 
            Russia 
            (pulp and paper): 10% (FSC-certified supplies from Ilim's 
            Bratsk mill for International Paper account for most of China's 
            imports of pulp from Russia) 
            Solomon 
            Islands: 90% (China 
            accounts for the great majority of the excess over Annual Allowable 
            Cut)  
          
             
              | China -imports of wood-based products 
                (2007) | 
               
                  Logs  
               | 
               
                 Sawn wood 
               | 
               
                 Plywood 
               | 
               
                 Wood-based pulp 
               | 
               
                  Paper 
               | 
               
                 Timber sector 
               | 
               
                 Timber sector 
               | 
               
                 Paper sector 
               | 
             
             
              |  
                
               | 


               | 
             
             
              |  
                
                
                 (million cubic metres) 
               | 
               
                 (million tonnes) 
               | 
               
                 % illegal 
               | 
               
                 mi m3 RWE 
               | 
               
                 mi m3 RWE 
               | 
               
                 mi m3 RWE 
               | 
             
             
              | Brazil (tropical) | 
               
                
               | 
               
                 0.3 
               | 
               
                
               | 
               
                
               | 
               
                
               | 
               
                 15% 
               | 
               
                 0.1 
               | 
               
                 0.2 
               | 
               
                
               | 
             
             
              | Burma | 
               
                 0.7 
               | 
               
                 0.3 
               | 
               
                
               | 
               
                
               | 
               
                
               | 
               
                 20% 
               | 
               
                 0.2 
               | 
               
                 1.1 
               | 
               
                
               | 
             
             
              | Cameroon | 
               
                 0.2 
               | 
               
                
               | 
               
                
               | 
               
                
               | 
               
                
               | 
               
                 30% 
               | 
               
                 0.1 
               | 
               
                 0.2 
               | 
               
                
               | 
             
             
              | Congo (Brazzaville) | 
               
                 0.3 
               | 
               
                
               | 
               
                
               | 
               
                
               | 
               
                
               | 
               
                 30% 
               | 
               
                 0.1 
               | 
               
                 0.3 
               | 
               
                
               | 
             
             
              | Equatorial Guinea | 
               
                 0.5 
               | 
               
                
               | 
               
                
               | 
               
                
               | 
               
                
               | 
               
                 30% 
               | 
               
                 0.1 
               | 
               
                 0.4 
               | 
               
                
               | 
             
             
              | Gabon | 
               
                 1.1 
               | 
               
                
               | 
               
                
               | 
               
                
               | 
               
                
               | 
               
                 30% 
               | 
               
                 0.4 
               | 
               
                 0.9 
               | 
               
                
               | 
             
             
              | Indonesia | 
               
                
               | 
               
                 0.3 
               | 
               
                 0.1 
               | 
               
                 1.1 
               | 
               
                 0.3 
               | 
               
                 55%-65% 
               | 
               
                 0.5 
               | 
               
                 0.5 
               | 
               
                 4.7 
               | 
             
             
              | Laos | 
               
                 0.1 
               | 
               
                
               | 
               
                
               | 
               
                
               | 
               
                
               | 
               
                 20% 
               | 
               
                 0.0 
               | 
               
                 0.1 
               | 
               
                
               | 
             
             
              | Malaysia | 
               
                 1.3 
               | 
               
                 0.3 
               | 
               
                 0.1 
               | 
               
                
               | 
               
                
               | 
               
                 10% 
               | 
               
                 0.2 
               | 
               
                 0.8 
               | 
               
                
               | 
             
             
              | Mozambique | 
               
                 0.2 
               | 
               
                
               | 
               
                
               | 
               
                
               | 
               
                
               | 
               
                 (30%) 
               | 
               
                 0.1 
               | 
               
                 0.2 
               | 
               
                
               | 
             
             
              | Papua New Guinea | 
               
                 2.3 
               | 
               
                
               | 
               
                
               | 
               
                
               | 
               
                
               | 
               
                 20% 
               | 
               
                 0.5 
               | 
               
                 2.1 
               | 
               
                
               | 
             
             
              | Russian Federation | 
               
                 25 
               | 
               
                 1.6 
               | 
               
                
               | 
               
                 1.0 
               | 
               
                 0.2 
               | 
               
                 40% 
               | 
               
                 11 
               | 
               
                 17 
               | 
               
                 0.5 
               | 
             
             
              | Solomon Islands | 
               
                 1.0 
               | 
               
                
               | 
               
                
               | 
               
                
               | 
               
                
               | 
               
                 20% 
               | 
               
                 0.2 
               | 
               
                 0.9 
               | 
               
                
               | 
             
             
              | Vietnam | 
               
                 0.2 
               | 
               
                
               | 
               
                
               | 
               
                
               | 
               
                
               | 
               
                 20% 
               | 
               
                 0.1 
               | 
               
                 0.2 
               | 
               
                
               | 
             
             
              | Subtotal | 
               
                
               | 
               
                
               | 
               
                
               | 
               
                
               | 
               
                
               | 
               
                
               | 
               
                 14 
               | 
               
                 25 
               | 
               
                 5 
               | 
             
             
              | China: IRW production | 
               
                 Assume 
                  100 million m3 of which 60% destined for the Timber sector 
                  (mainly as panels) 
               | 
               
                 30% 
               | 
               
                 18 
               | 
               
                 24 
               | 
               
                 16 
               | 
             
             
              | % illegal (imports + IRW production) | 
               
                 Estimated 
                  RWE volume of imports (mi m3): 
                  52 (Timber Sector) and 52 (Paper Sector) 
               | 
               
                 28% 
               | 
               
                 44% 
               | 
               
                 23% 
               | 
             
           
          China - illegal 
            exports 
            The table above indicates that 30% -40% of industrial consumption 
            (IRW production + imports) by China's Timber sector might comprise 
            Illegal Timber. In addition to that illegality in raw materials supply, 
            estimates of the Illegal Timber content of China's exports should 
            reflect (a) the extent of fraud in the description of the exported 
            products, (b) compliance with environmental, planning, financial, 
            labour and other regulations pertaining to their manufacture, and 
            (c) composite products might have either a Legal Timber cores and 
            Illegal Timber outer surface or vice versa. Consequently, it 
            would seem reasonable to assume rather more than 40% of China's Timber 
            sector exports comprise Illegal Timber. It would likewise seem reasonable 
            to assume that llegal Timber accounts for more than one quarter of 
            China's Paper sector exports - perhaps more given that the leading 
            manufacturer accounts for much of China's imports of pulp from Indonesia 
            and has been conspicuous 
            as a buyer of Illegal Timber (as pulpwood) grown in China. That enterprise, 
            through its parent group Sinar 
            Mas and with one of China's major petrochemical groups (CNOOC) 
            is promoting the conversion of natural forest in Papua to palm plantations 
            for agro-fuel. 
          There is some 
            validity to assertions 
            that, if China exports any illegal timber, then it does so merely 
            to meet demand for this in the countries to which those exports are 
            destined. Such statements should prompt those destination countries 
            to refuse to permit the import of wood-based products made in China 
            if these are not credibly certified as being legal. Doing so would 
            place much of China's timber industry, and those parts of China's 
            paper industry which are associated with Indonesia, at risk. However, 
            China accounts for an increasing share in the High Risk timber 
            imports of several countries. 
          A few minutes' 
            targetted analysis of UN Comtrade statistics shows clearly that China 
            accounts for most of the growth in world trade in timber and that 
            its timber exports are rising at about 30% per annum. Further, 
            China appears to doing very little effectively to reduce its production 
            (e.g. in Yunnan) and imports of Illegal Timber. 
            It is therefore remarkable that the much praised EU 
            FLEGT initiative appears to have assigned a very low priority 
            to establishing a Voluntary Partnership Agreement with China. Indeed, 
            China is probably the only country whose exports of Illegal Timber 
            to the EU are rising.  
          The species from 
            which the wood-based products which China exports in greatest quantity 
            tend not (yet) to be declared in national trade statistics. A large 
            proportion of those exports comprises commodities (notably furniture) 
            for which, unlike most other major trading nations, China and its 
            main partner - the USA - choose not to declare weight or other physical 
            measure of quantity. 
          In order to overcome 
            these shortcomings in trade statistics, assumptions have been made 
            - most notably that the total roundwood equivalent 
            volume of tropical, Chinese, Russian, North American and rubberwood 
            in the trade in wooden furniture from China to the USA are 20%, 20%, 
            30%, 20% and 10% respectively. Analysis 
            of China's timber imports from the USA and China's timber exports 
            to the USA indicates that most of the latter probably derives 
            from forests other than in the USA. 
           |